
The trading world is known for its beautiful one-liners that are all so true, but at the same time so extremely difficult to practice. Some of the most well known around are: "Cut your losses and let your profits run." or "The trend is your friend." (until it isn't), just to mention a few. Collecting more of those one-liners would be a great subject for another article. This post deals with getting with the trend.
The obvious problem with trends is they don't announce themselves. Sure, anybody can point out a trend, but only by looking back. And once the trend has started, we feel reluctant to get into a position because our basic instinct only accepts exact bottoms and tops as good long/short entries. Any other entry feels like a failure because we missed out on getting the absolute best price. But in reality there's no other option left for trend traders than to accept a price that has already made a significant move in a certain direction.
Let's assume the bullish scenario where a trader wants to get long in an up trending market. The general approach is of course to buy into intraday weakness. But how much intraday weakness should one expect? Stop reading here, and make a guess. Is -0,1% a good moment to go long? Or wait for -0,5% and then get long?
It's time to get the statistics out. We're looking at the last 50 years of S&P 500 data (open, high, low and close), but it's the same for only the last 10 year. From my database, I've pulled up every trading day in the S&P 500 that had a higher close than the day before and took a look at how far the market would drop intraday before making it to a higher close. 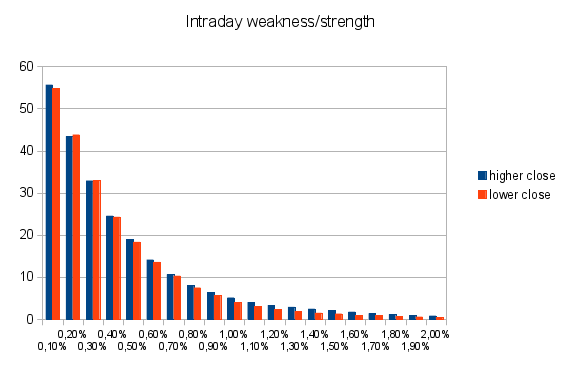
The chart shows the bullish scenario in blue bars, the bearish scenario in orange bars. Let's look at the bullish scenario first, from left to right, blue bars. First bar: of the higher closing days, 55% had an intraday low of -0,1% or more. Next bar, 43% of the higher closing days had an intraday low of -0,2% or more. Third bar, 33% of the higher closing days had an intraday low of -0,3% or more, etc.
Now let's look at the bearish scenario. Again from left to right, now the orange bars. First bar says: of the lower closing days, 54% had an intraday high of +0.1% or more. Second bar: of the lower closing days 44% had an intraday high of +0,2% or more. Third bar: of the lower closing days, 33% had an intraday high of +0,3% or more, etc.
So to sum it up: if a trader wants to buy into a long position in a bull market, he shouldn't expect a huge intraday pull back as a means to comfort his ego but as a result missing out on the trade in the end. The same applies for selling short in a bearish market.
Another compelling conclusion could be: if we see an intraday pull back of let's say -0,6%, there's only a 14% chance of getting a higher close.
But as always when working with chances, there's the possibility of the so called tail risk where the unimaginable could happen, for instance October 16th, 2008: pullback of -4,6% and yet a higher close(!)